<%NUMBERING1%>.<%NUMBERING2%>.<%NUMBERING3%> PRTG Manual: Review Monitoring Data
Pages of probes, groups, device, and sensors have a tab-like interface. Using the tabs you can navigate through various sub-pages of an object in order to show your network's status, view monitoring results, or change settings.
Tabs Bar on Sensor Pages
The Overview tab shows an overview of the currently selected object and of its sensors. The pages share a common layout, but include different elements, depending on the kind of object you look at:
- For probes and groups, the Overview tab shows a tree-like view with devices and sensors, a Geo Map, as well as summary graphs for different time spans of the current probe or group.
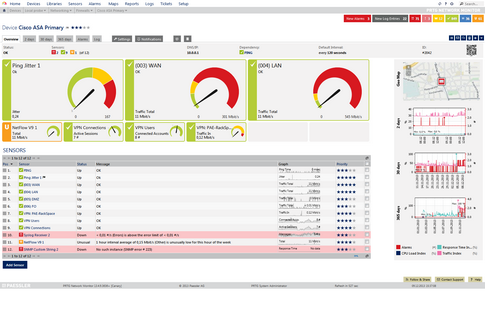
- For devices, the Overview tab shows device details, a Geo Map, and summary graphs for different time spans, colored gauges for high priority sensors, as well as a table list of all sensors on this device.
Note: In order to display gauges which represent sensor states, corresponding sensors need to be tagged with 4 stars (****) or 5 stars (*****) in the priority settings. 5 stars sensors will be represented with bigger gauges than 4 stars sensors. - For sensors, the Overview tab shows sensor details, current status, colored gauges which represent the last value of particular sensor channels (the primary channel in biggest size; not available for the Downtime channel), sensor graphs for different time spans, a table with all sensor channels, as well as similar sensors which show correlations in your network.
Note: For sensors using lookups, we recommend staying below 120 lookup values in the primary channel to get expressive gauges. For sensors with a priority of 4 stars, the upper limit is around 40 lookup values.

Device Overview Tab with Gauges for High Priority Sensors, Sensors Table List, Geo Map, and Mini Graphs
Toplists are available for xFlow and Packet Sniffer sensors only. Toplist graphs are displayed right on the sensor overview page. Please see section Toplists.
Select one of the tabs Live Data (available for sensors only), 2 days, 30 days, or 365 days to display an object's monitoring data live (sensors only), or for different time spans and in more or less detail. Note: The days mentioned here are the default setting. You can change the detail of the different graphs any time in the system administration.

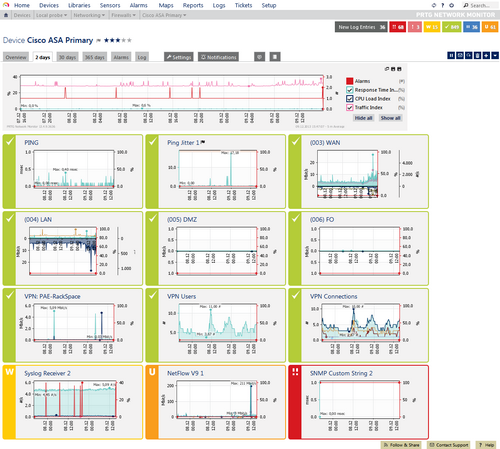
2 Days Tab of a Firewall with Overview Graph and Sensor Mini Graphs
Live Data and Data By x Days—Probes, Groups, and Devices
For probes, groups, and devices, each of the tabs shows a summary graph for the current object and mini graphs for all sensors on this object, as well as a data table for the current object. There are never more than 50 mini graphs displayed for performance reasons. Hover a mini graph to see the graph legend.
The summary graph shows the number of alarms as well as three index graphs. These graphs indicate response time, CPU usage, and bandwidth usage for all sensors. Index graphs are similar to a stock index. The shown values are based on the readings of all sensors of this object. PRTG computes these values using statistics and by comparing the values to the highest and lowest readings ever recorded.
The three index graphs shows overall (or global) trends in your network. If these values increase during a specific time frame, then CPU load, bandwidth load, or response time respectively have worsened during this time. For example, a CPU Load Index value of 90% means that the average CPU load for all CPU sensors of your current configuration is at 90% of the highest ever measured CPU usage value.
The following four channels are available in the summary graph:
- Alarms: Sums up the number of all down states of sensors on this object during the given time span. This graph provides you a bird's eye view of trouble in your network. It cannot be hided.
- Response Time Index: Indicates request times in your network.
- CPU Load Index: Indicates the CPU usage in your network.
- Traffic Index: Indicates the bandwidth usage in your network.
See section More for a detailed description of the index graphs.
You can hide single channels individually except the "Alarms" channel. Simply remove the check mark symbol in front of a channel name besides the graph, and the according channel's line will disappear. You can also Show all or Hide all channels by clicking on the buttons underneath the channel names. The graph view will be reset immediately.

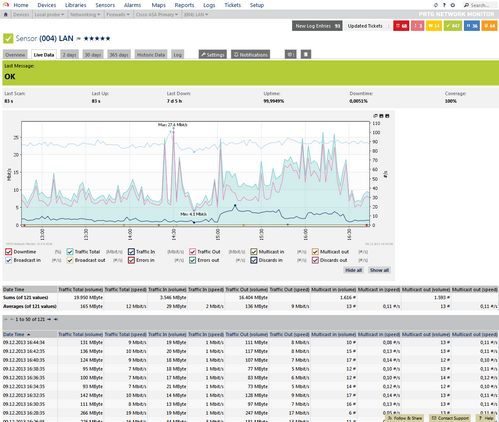
Sensor Live Data Tab for a Traffic Sensor
Live Data and Data By x Days—Sensors
For sensors, the tabs show a graph and data table of the selected sensor. When viewing data of a sensor running on a cluster probe, you can additionally select if you want to show the data of all nodes, or of one specific node only. Please use the Select Cluster Member bar below the tabs. Note: Multi-node graphs are never displayed filled here, but with single lines only. However, historic data reports can have filled multi-node graphs.
While viewing a sensor graph you can hide single sensor channels individually. Simply remove the check mark symbol in front of a channel name underneath the graph, and the according channel's line will disappear. You can also Show all or Hide all channels by clicking on the buttons besides the channel names. The graph view will be reset immediately.
In the upper right corner of every graph, you will find three small icons. Using them, you can do the following:
- Zoom graph in new window: This will open a larger version of the graph in a new browser window.
- Download the graph (PNG or SVG): This will show a PNG or SVG file of the graph in a new browser window. You can then save or copy it for later use.
The Historic Data tab is available for sensors only. Please see section Historic Data Reports.
Viewing lists of sensors is a great way to keep an eye on your network's status, as you can select which kind of sensors you would like to see. There are many different sensor list views available, such as a list of favorite sensors and top 10 lists; lists filtered by current sensor status, value, availability, tag, or type; there is a sensor cross reference, and many more.
Sensor lists are available from the main menu bar. Click the Sensors entry to show a table list of all sensors. In the table list appearing, you can re-sort the items by clicking on the column's header items. Hover to show other menu options. For detailed information about the available options, please see Main Menu Structure (Sensors) section.
The Alarms tab is not available for sensors, but for probes, groups, and devices only. Please see section Alarms.
The logs tab shows past activities and events regarding the currently selected object. Please see section Logs.
Knowledge Base: How does PRTG compute CPU Index, Traffic Index and Response Time Index?
Other Ajax Web Interface Sections |
|---|
Related Topics |
|---|
Keywords: 2 days tab,30 days tab,365 days tab,Live Data tab,Overview tab