<%NUMBERING1%>.<%NUMBERING2%>.<%NUMBERING3%> PRTG Manual: Logs
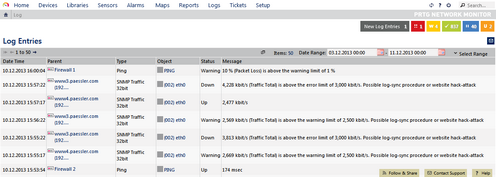
The Logs list shows all past activities and events of your PRTG monitoring setup. This is useful to keep track of all important activities and, for example, to check whether messages were sent, etc. In a typical setup, a huge amount of data is produced here. As the activity of every single object is minuted, you can use this data to check exactly if your setup works as expected.
To support you when viewing the log files, there are several filters available. Please see Working with Table Lists section for more information.

List with Log Entries
There are two possibilities to call the logs list: Either you click on the Log tab on the detail page of a probe, group, device, or sensor, or you choose the Logs entry in the main menu.
Pages of probes, groups, device, and sensors have a tab-like interface. Using the tabs you can navigate through various sub-pages of an object in order to show your network's status, view monitoring results, or change settings.
Tabs Bar on Group and Probe Level
On an object's detail view, click on the Log tab to show a table list with all log information on this object. This is a more detailed log than the system log available via the Logs | All option in main menu.
Click the Logs entry from the main menu to show a table list of all system log entries in your configuration. Hover the Logs entry and select another option to only show a subset of entries for certain objects for certain kind of entries. Choose between:
- All
Show log information for all objects in your configuration, newest first. - By Group ›
Show log information for objects in a certain group only, newest first. Hover to show other menu items. Select All, or follow the menu path (it is specific to your setup) to select a group you would like to show log information for. - Status Changes ›
Show log information for certain status changes only. Hover to show other menu items. Follow the menu path to view log entries with a special value in the Status field only. Select between Up & Down (shows entries with either Up or Down in the Status field), Down, Warning, Unusual, Up, Paused/Resumed (shows entries with either Paused or Resumed in the Status field), or Acknowledged Alarms. - System Events ›
Show log information regarding certain system event types only. Hover to show other menu items. Select between the following event types: Probe Related, Cluster Related, Auto-Discovery, Notifications, or Status Messages. - Object History
Shows information about changes to the PRTG setup and lists deletions of subordinate system objects. The object history page has a tab-like interface. Using the tabs you can navigate through various sub-pages in order to view the changes to all related settings and deletions of objects. Select between the following tabs: My Account, System Setup, Notifications, Schedules, User Accounts, User Groups, Reports, Libraries, or Maps.
Note: You can open a specific tab directly with the context button History in the page header bar on the corresponding pages.
Other Ajax Web Interface Sections |
|---|
Related Topics |
|---|
Keywords: