<%NUMBERING1%>.<%NUMBERING2%>.<%NUMBERING3%> PRTG Manual: Monitoring Virtual Environments
A highly flexible IT infrastructure is a common need nowadays and virtualization has become an important pillar of the IT all over the world. Applications in your network might be distributed over many different servers, networks and locations. They might also be in the cloud, and your computations can take place in data centers spread over the whole world. So, if your network connection or any other corresponding hardware fails, hundreds of applications might be unavailable—an impact to your daily business processes which should be avoided at any costs.
Because of this, monitoring the physical infrastructure of your data center is still a must in times of virtual environments. With the layer of virtualization in addition to your physical equipment, your logical infrastructure needs also a close treatment. PRTG assists you to deal with these advanced requirements and enables you to react proactively to issues before they affect your whole system. With PRTG you can monitor all layers of your IT infrastructure in a comprehensible way so you will reduce issues related to dynamic IT environments significantly.
Monitoring All Layers of Your IT Infrastructure
In general, you can assume that with the layer of virtualization you have to monitor a total of four layers in your IT infrastructure:
- Hardware (Server Racks): Usually you will set up your monitoring in the common way and monitor most of the hardware components in your network with PRTG's SNMP sensors. You are able to gain monitoring data about many different device readings such as CPU load, memory, disk space, etc. with this monitoring technology, as well as information about network traffic and bandwidth usage of your routers and switches. It is absolutely mandatory for a working IT environment to monitor all hardware components in order to be alerted if something fails or hardware resources are running out. In addition, you can identify potential bottlenecks affecting your virtualized infrastructure. You can set this monitoring up in usual way.
- Host Server Hardware: It is essential to monitor the host hardware of your virtualization solution explicitly. If you have issues with your virtual machines (VMs), the origin might be a host hardware failure. You should closely monitor your VM host servers to get alerted if the status is other than "normal". Besides the out of the box hardware sensors, PRTG provides specific sensors for various virtualization host servers; the following monitoring data of your host servers will help you prevent issues in virtualized environments:
- VMware: current reading and health status (via WBEM), a general status as shown in vSphere (via SOAP), and disk space on ESX(i) (via SSH)
- Hyper-V: host health critical values, deposited pages, network traffic, CPU usage of guests, hypervisor, and in total
- Citrix XenServer: CPU, memory, and network usage, the number of running virtual machines on the host server, and load average
- SCVMM: CPU usage, free memory (in bytes and percent), overall status, communication status, cluster node status, virtual server status, computer status, and the number of VMs
- VMs from the "Outside": The virtual machines run on their particular host servers. PRTG can show you the status of single virtual machines and several of their performance counters. It might be helpful to know which resources a single VM uses and needs, but monitoring single VMs is not advisable in every case because it has noticeable influence on the overall performance. Often it will be sufficient to monitor only VMs which are critical for your network. If a VM reaches its capacity limits, PRTG can alert you and you can conduct according resolution steps like enhancing this VM's resources. Indicators for a healthy virtual machine which you can monitor with PRTG out of the box are:
- VMware: CPU and memory usage, disk read and write speed, read and write latency, and network usage
- Hyper-V: CPU usage, disk read and write speed
- Citrix XenServer: CPU usage and free memory
- SCVMM: CPU usage, disk read and write speed, and the status of the VM
- Virtuozzo: disk space and network usage
- VMs from the "Inside" (Operating Systems): You can monitor the Windows operating system of a single VM with PRTG's standard WMI sensors, for example. With this technology you can access data of various Windows parameters. Other operating systems like Linux/MacOS can make data available via SSH and SNMP. The status of the operating systems on your VMs can indicate potential issues of the same, just like the operating systems on your physical machines which are important for a reliably working IT infrastructure: You can monitor these with the same attention, depending on your application scenario, but be careful due to performance considerations. Especially many WMI sensors can result in load problems, so monitor only really important systems "from the inside". Furthermore, you do not need to monitor every item multiple times. For example, it might be sufficient to monitor free disk space only from the outside of the actual VM.
Monitoring the Virtual Infrastructure
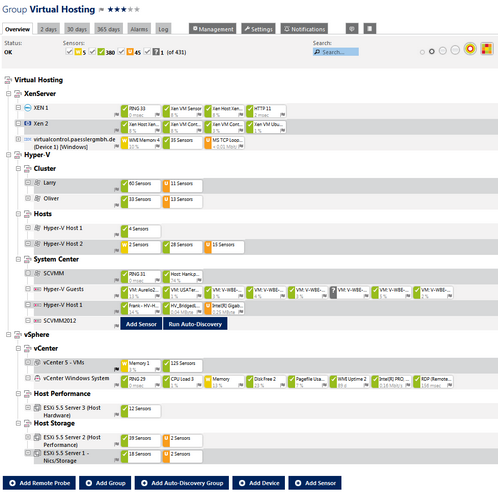
In order to monitor your IT infrastructure, best practice is to set up the monitoring of the hardware layer of your data center first in PRTG, especially in order to find potential bottlenecks which might have an impact on your virtual servers. Then you can start monitoring your virtual environment itself. If you use several solutions for virtual hosting, it is also a good idea to group related host servers, their virtual machines, and the operating systems together. The screenshot below will give you an idea about how to organize this.
Grouped Virtual Components
The screenshot above shows you the particular group "Virtual Hosting" of an entire PRTG setup. This is an example how monitoring of virtual environments can look like. The sample group contains several subgroups for the virtualization solutions Citrix "XenServer", Microsoft "Hyper-V", and VMware "vSphere". The vSphere group, for example, has three subgroups: we monitor the vCenter VMs and the vCenter Windows system, the performance of the host server, and the storage system of the host.
In PRTG, set up devices which represent the physical hosts of your virtual machines. For example, for your VMware hosts, add devices which represent the ESX/ESXi servers, for Hyper-V add devices which represent your Hyper-V host servers, for Citrix add devices which represent your Xen servers. If you manage these hosts with a Microsoft System Center Virtual Machine Manager (SCVMM), you can also (or alternatively) add a device for the SCVMM.
Then you can add suitable and expressive sensors to the host server devices. Running PRTG's auto-discovery, many useful sensors will be created automatically. There are several pre-configured host hardware sensors available out of the box in PRTG:
- VMware Host Hardware (WBEM) Sensor: monitors an ESX(i) server via Web-Based Enterprise Management (WBEM)
- VMware Host Hardware Status (SOAP) Sensor: monitors a VMware host server via Simple Object Access Protocol (SOAP)
- VMware Host Performance (SOAP) Sensor: monitors a VMware host server via Simple Object Access Protocol (SOAP)
- Hyper-V Host Sensor: monitors via Windows Performance Counters or Windows Management Instrumentation (WMI), as configured in the "Windows Compatibility Options" of the parent device
- Citrix XenServer Host Sensor: monitors via Hypertext Transfer Protocol (HTTP)
- SCVMM Host Sensor: monitors, for example, a Hyper-V host, a VMware host, or a XenServer host which is managed by a System Center Virtual Machine Manager (SCVMM)
These sensor types monitor hardware specific counters to ensure that no hardware issues affect your actual virtual machines. Additional sensor types can monitor the host hardware via SNMP (for example, traffic and custom requests) and SSH (for example, disk space of VMware ESX(i) servers), as well as there are sensors for network adapters and storage devices which are connected to a Hyper-V host server. You can also monitor Virtuozzo host servers with sensors for network usage and disk space for each container.
In order to monitor your actual virtual machines, add them to your host servers in PRTG. For a better overview, you might want to add another device to PRTG which represents your host server and add sensors for your VM to there. The according sensors for virtual machines will show you the performance of single VMs as well as their usage of resources. This will help you identify VMs with poor performance and react proactively before one or more VMs crash. As mentioned above, you can additionally monitor your particular VMs from the inside (i.e., the operating systems on your VMs) if necessary. See the sections below for details about particular virtualization solutions.
PRTG's VMware Virtual Machine (SOAP) Sensor monitors VMs on a VMware host server via Simple Object Access Protocol (SOAP). With the VMware system, the general idea is to add a vCenter server as a device to PRTG and use the vCenter as parent device where you add the sensors to for your virtual machines. So, in the case of vMotion when your VMs change their host server, PRTG will be able to follow these movements and will never lose the monitored VMs.
For this sensor type, you need the Microsoft .NET Framework with the latest update of version 4.0 running on the probe machine. If you use many VMware sensors, we also recommend adjusting the settings on your VMware host server to accept more incoming connections.
vSphere Group
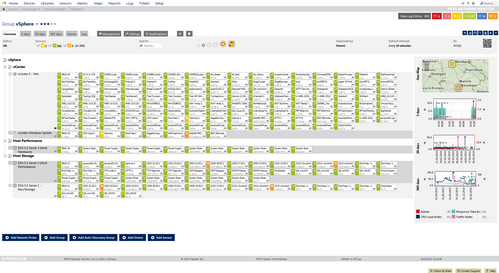
This screenshot a sample vSphere group in PRTG. As recommended, the VMware virtual machines are added to the vCenter device. There is also a dedicated device for the vCenter Windows operating system with common WMI sensors for CPU, memory, disk, and network usage. The ESXi host servers are organized in their own groups regarding performance and storage. In this example, PRTG monitors the hosts with the standard SNMP hardware sensors as well as with the specific VMware ESXi host sensors.
Microsoft Hyper-V Virtual Machine
PRTG's Hyper-V Virtual Machine Sensor monitors VMs via Windows Performance Counters or Windows Management Instrumentation (WMI), as configured in the "Windows Compatibility Options" of the parent device. With this hybrid approach, the sensor first tries to query data via performance counters and uses WMI as a fallback if there are no performance counters available. Performance counters in general need less system resources than WMI. We recommend using System Center Virtual Machine Manager (SCVMM) as parent device for this sensor type, because when your VMs change their physical host with Live Migration, this sensor will still be able to continue monitoring. You should also disable User Account Control (UAC) in the Windows operating system of the VM.
Hyper-V Group
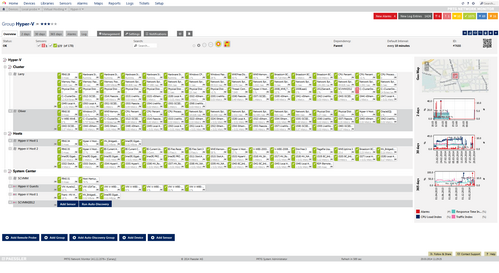
This screenshot shows a sample Hyper-V group in PRTG. There is a dedicated group for failover clustering where two nodes are monitored with several SNMP and WMI sensors, as well as Hyper-V Host Server sensors and sensors for the Hyper-V virtual machines. This ensures that Hyper-V and failover clustering works without any issues. The Hyper-V hosts are monitored the same way, organized in a dedicated group for hosts.
Note that we recommend adding the particular virtual machines to the SCVMM server if possible! We pointed out above that you should add the VMs to an SCVMM server to avoid issues with Live Migration. You can see this in the group "System Center". The particular VMs are added to the dedicated device "Hyper-V Guests". The SCVMM itself is monitored as described below.
Citrix XenServer Virtual Machine
PRTG's Citrix XenServer Virtual Machine Sensor monitors VMs via Hypertext Transfer Protocol (HTTP). For this sensor type, you have to add a device to PRTG which represents a Citrix XenServer with version 5.0 or later. Another requirement is the Microsoft .NET Framework: You have to run the latest update of version 4.0 on the probe machine where you add this sensor to.
In a XenServer pool, every host knows each running VM. Because of this, there is no central instance which provides all available data so it does not matter on which host you query your VMs. All queries on any host are automatically forwarded to the pool master which manages the XenServer pool. So it is sufficient to create the desired sensors for your XenServer VMs on a device that represents one host server of your pool. PRTG's XenServer sensors can figure out by themselves which host is running and retrieve the according data.
XenServer Group
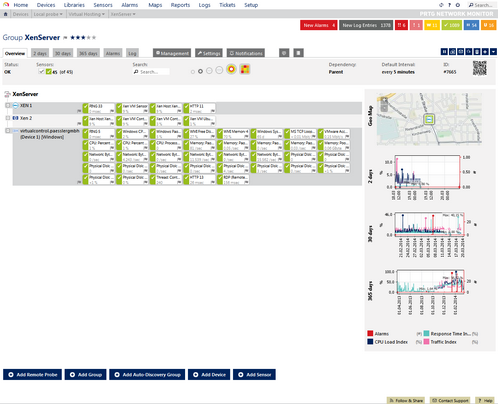
This screenshot shows a sample XenServer group in PRTG. There are two devices for XenServer hosts (Xen 1 and Xen 2), each with a Citrix XenServer Host sensor and several Citrix XenServer Virtual Machine sensors for the particular VMs on this host. Furthermore, the Windows operating system is represented as a dedicated device ("virtualcontrol") which is monitored with several WMI sensors regrading CPU, disk, memory, and network usage.
Microsoft SCVMM Virtual Machine
With the SCVMM Virtual Machine Sensor you can monitor VMs which are managed by a System Center Virtual Machine Manager (SCVMM), for example, Hyper-V or VMware. Requirements for this sensor type to work are the Microsoft .NET Framework with version 4.0 and the latest update, Remote PowerShell 2.0, and the VMM PowerShell Plugin. If you add your SCVMM server to PRTG, PRTG will be able to follow movements of your VMs automatically.
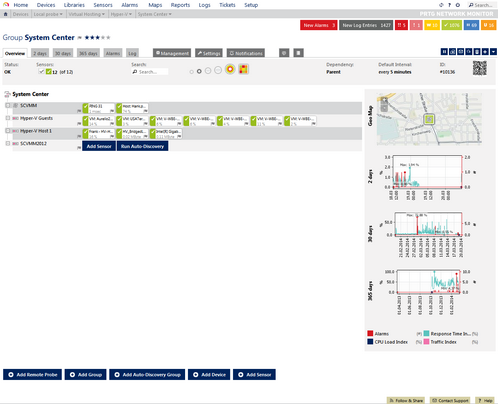
SCVMM Group
This screenshot shows a group for an SCVMM server in PRTG which manages Hyper-V virtual machines. The SCVMM server is monitored with the SCVMM Host sensor which shows several kinds of server states and usage parameters. Several virtual machines are added to the "Hyper-V Guests" device (as SCVMM Virtual Machine sensors) so that PRTG can automatically detect changed VM host devices.
The sensor types described in this section monitor virtual machine specific counters in order to ensure that all your VMs have enough resources available. If a VM is overloaded, PRTG can notify you immediately and you can proactively take care of issues before a particular VM has an outage or other failures. Additionally, we have shown an idea for a structured virtual monitoring with several recommendations.
You can find all available sensors for virtual servers and the according virtual machines in section List of Available Sensor Types—Virtual Servers Sensors.
Knowledge Base: I run PRTG on VMware. How can I obtain best performance?
Paessler Blog: Virtualization and Network Monitoring
Paessler Blog: Virtualization and Network Monitoring: PRTG Supports the new VMware ESXi 5.5!
Keywords: